I have a project group containing 10-15 applications or packages.
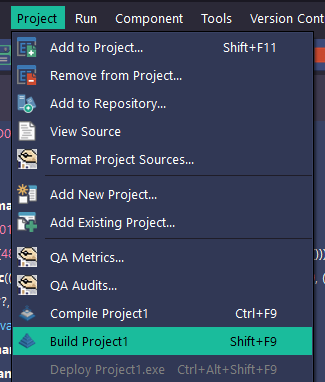
When I try to debug one of my applications the IDE is not detecting that I am wanted to run in debug mode as the debug breakpoints are disabled and hence, I assume, no debug window is shown.
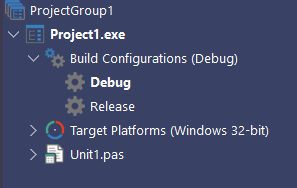
The default configuration is the Debug configuration and the Debug configuration in the project options has the DEBUG option included in the conditional defines.
I am at a loss as to why I cannot debug my code and am wondering if anyone in ADUG-Delphi land can assist me.
The problem does not occur for all projects as any new project can be debugged.
I just tried an earlier program in the project group and when I started to debug this program I got a dialog with ‘Updating Configuration’ in the caption and nothing else and the debug window opened.
I then tried my problem program again but still got no debug window.
I have also reinstalled Delphi 12 from scratch again and the problem disappeared (that is I could debug my app) but now I am back to being unable to debug my app.
I am running Delphi 12 Version 29.0.53982.0329 with update 2 on Windows 12 version 22H2 64 bit.
Does anyone have any ideas?
Is there anyone who could assist?
This could be because of the current .dproj file, created with an older Delphi version, conflicts with Delphi 12.
=> I would suggest you to delete your current .dproj file (make a copy first), open the project in the IDE, and see if the Debug build configuration behaves correctly.
If it does, you can then manually add steps by steps all the necessary settings from your old .dproj
If you are hitting breakpoints, but it’s bringing up the cpu/assembly window, I think people here have had that battle before.
(was it possibly associated with the option to trace into the RTL?)
Is the project an application (.exe) or a DLL? I get the same thing when debugging a DLL when the registered DLL isn’t in the same place as expected, the host application runs the wrong DLL… Also try deleting all DCU files…
Is the unit with the breakpoint part of a package or exe project?
Most likely causes are:
One or more projects in the group are set to Release instead of Debug (or were at some point). Use the “set active configuration” drop down at the top of the project manager and select Debug to make sure all are debug
There is a stale DCU that was compiled in release mode. Could just be that the project(s) it is in needs to be built again, or there are old DCUs lying around in other folders in the path. Do a “build all” after the prev check
Inconsistent paths across projects, related to prev possibility (check output paths are what you expect)
Edit: two other possible causes:
A second copy of the source file floating around and the one open in the IDE with breakpoints is not the one that gets compiled
Hard to tell based on the symptoms you described but sometimes the editor thinks that the source lines are offset and the breakpoint is actually on a non-code line such as a comment/blank line. This tends to happen with some use of anonymous methods. Probably a mismatch between the editor line numbers and the line numbers the compiler outputs. Check the alignment of the gutter dots and executable code lines. Litter the method with breakpoints on other lines (blank/comment) to see if those work
The cause was an incorrectly specified environment variable. I use this variable in the path names for the dcp folder, the pkg folder the dcu folder and the search folders.
The value I wanted was ‘R:’ (without the quotes).
I believed that I had used the … button when specifying the variable’s value without really looking at what was returned. The string being returned was 'R:' and all my folder names had double 's. For example my dcu folder was R:\dcu instead of R:\dcu.
Hope you can understand my response.
Anyway thank you for all your assistance - I did lean a lot from your comments.