FastMM is reporting a memory leak of a number of unicodestring objects. The number of leaked objects seems roughly related to the number of Indy TCP sessions created and destroyed. I have an instance of my own objects created and destroyed for ever Indy one so I do not suspect Indy.
The weird thing is that every leak is exactly the same.
22 bytes same data
~~~
--------------------------------2025-11-12 10:10:21.141--------------------------------
A memory block has been leaked. The size is: 22
The block is currently used for an object of class: UnicodeString
Current memory dump of 30 bytes starting at pointer address 5032A08:
B0 04 02 00 01 00 00 00 02 00 00 00 3C 00 3E 00 00 00 99 92 50 00 DD 01 F0 38 03 05 00 00
. . . . . . . . . . . . < . > . . . . . P . . . . 8 . . . .
--------------------------------2025-11-12 10:10:21.141--------------------------------
This application has leaked memory. The leaks ordered by size are:
22: 2 x UnicodeString
~~~
Up to 30 to 40 leaks per code run. Many repeated runs. All leaks identical.
I am about to try and decode the data leaked into a unicode string but have no confidence that will help.
Can you progressively neuter some of the functional steps of the program to try to narrow down the location or the logic in which it seems that something is going slightly sideways?
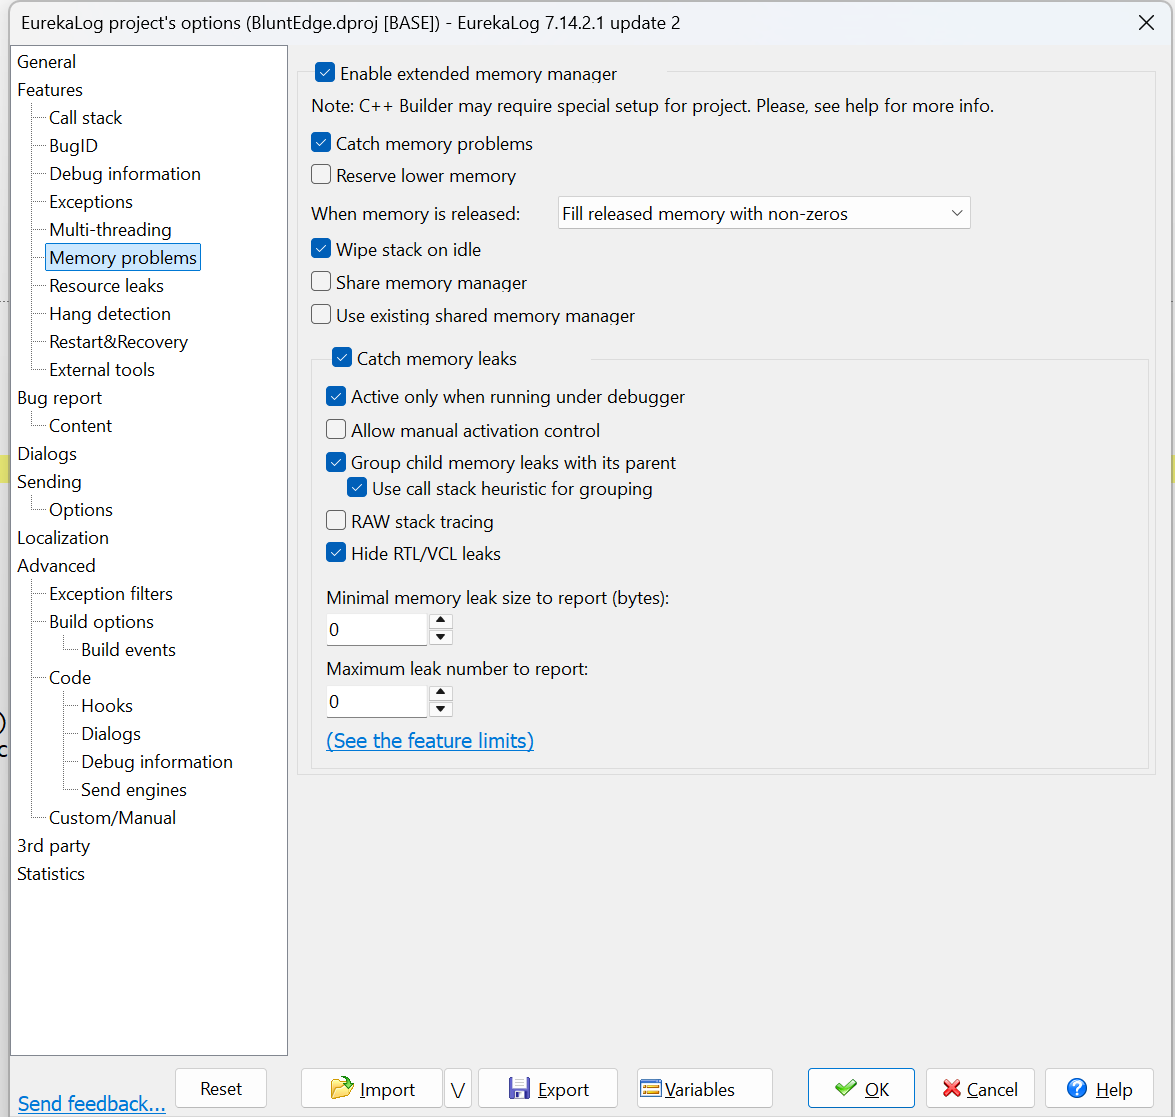
You might try using EurekaLog’s Memory Problems feature. It can build stack traces for each leak that it detects. It can also detect reuse-after-free bugs where your code calls methods in a previously freed object. It can send bug reports back to your development team via a number of different methods.
There is a free trial version you can use in non-production code, but that would be good enough to find your bugs.
Full disclosure: I work for Neos Eureka s.r.l, the maker of EurekaLog.
Here is a screenshot of our Memory Problems page - it allows you to configure how EurekaLog will detect and report on Heap and Stack-related bugs.
I remember a similar memory leak due to a string threadvar.
See https://docwiki.embarcadero.com/RADStudio/Florence/en/Variables_(Delphi)#Thread-local_Variables: Dynamic variables that are ordinarily managed by the compiler (long strings, wide strings, dynamic arrays, variants, and interfaces) can be declared with threadvar, but the compiler does not automatically free the heap-allocated memory created by each thread of execution. If you use these data types in thread variables, it is your responsibility to dispose of their memory from within the thread, before the thread terminates. For example:
 threadvar S: AnsiString;
 S := 'ABCDEFGHIJKLMNOPQRSTUVWXYZ';
   ...
 S := '';  // free the memory used by S
Have you enabled the debug (FullDebugMode)? You should get a very usefull callstack for each leak. Usually when strings are leaking it actually means some object (containing that string) is leaking. So chase out all other leaks first.
“The Compiler does not clear heap-allocated memory” might be the clue. I do not use threadvar in MY code but there is lots of thread stuff going on.
It took a lot of effort to actually give the thread objects time to terminate before FastMM did its stuff so I could be sure no memory was leaking. These unicodestrings are an issue because I seem to get one leak for each interaction after all objects are destroyed. As the code is expected to run forever without rebooting 22 bytes leaks will eventually cause a problem.