I thought that It might help someone else if I posted some hints on debugging TMS Webcore.
It happens in the browsers developer tools (not in the Delphi IDE). Your source is visible there for stepping through.
The keys are different, I keep hitting the Delphi ones. Maybe I can re-allocate them.
Breakpoints are not dynamic. They have to be put in before you run the application.
You cant put a breakpoint on begin. If you do, it doesnt compile and gives you a bogus error. I re-wound my code and re-installed stuff before I realised what was happening.
Mind you I was able to set an additional breakpoint after the application had started and I had hit the first two breakpoints already.
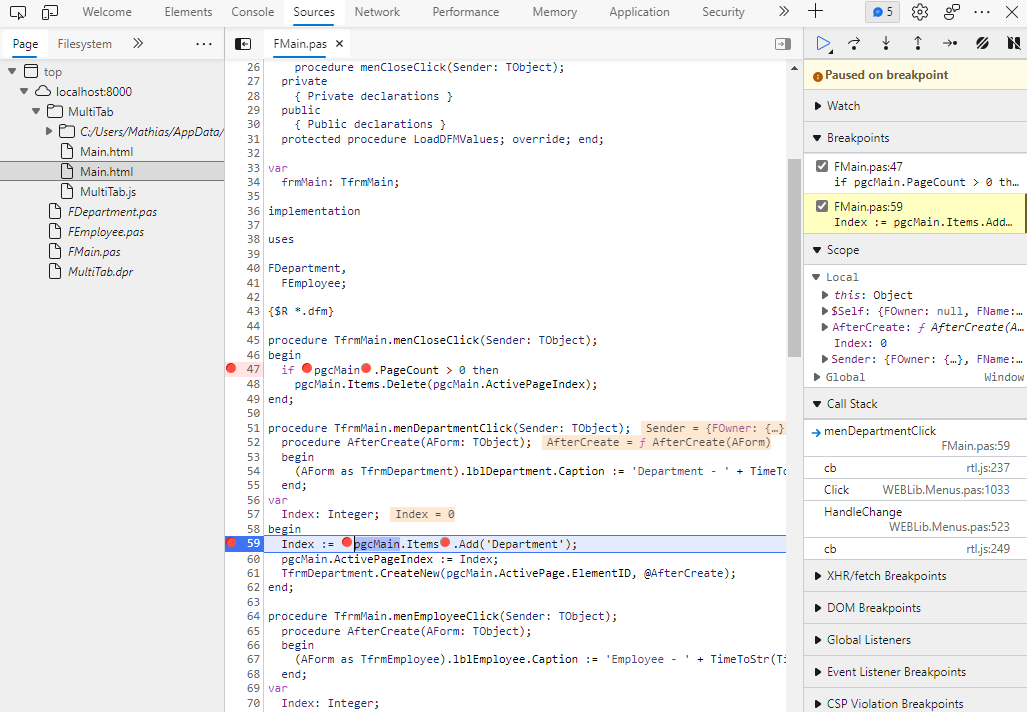
We just need to get used to the debugger tools of the browser. But for the debug version we still have the Map file to step through the Object Pascal code in the browser. See also my screenshot below.
Both are possible.You can set breakpoint in Delphi IDE, and you can set breakpoint in developer console of webbrowser. When set in IDE, be sure to recompile the application. In developer console you can see asm debugger; end; is inserted in source code.