I am currently running the same application 5 times.
Three versions are compiled without debug code two version with debug code but not running in debug.
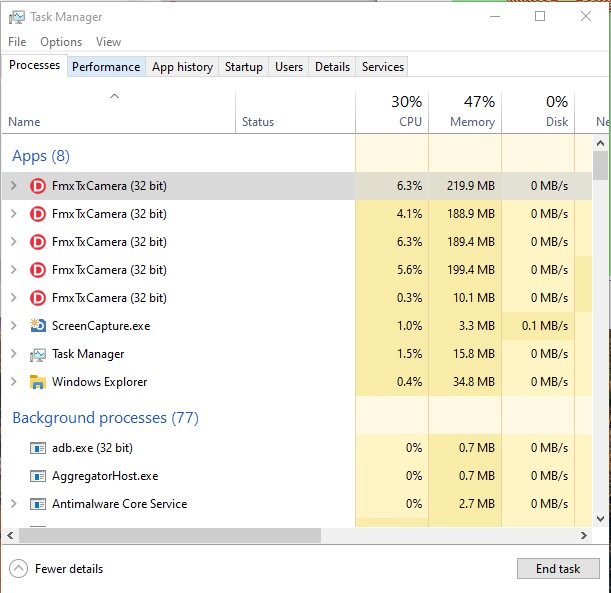
I suspect there may be an issue with them consuming memory or going into a closed loop hogging the CPU so I look at Taskmanager on Windows. Four copies are each using 3% - 5% of CPU and about 200MB of memory. The fifth less than 0.3% CPU and only 10MB memory.
All instances are busy generating a moving image to replicate a camera feed and presenting it in an FMX TImage Control on the form. One instance dispatches the images twice over TCPIP and recovers one of those to also present in a TImageControl. A second instance recovers a dispatched TCPIP image and presents it.
So I have one very busy image, one less busy image and three even less busy. Any idea how to explain the Taskmanager presentation? Is it just that Taskmanager is misleading?
It turns out the second instance was recovering the TCPIP image and was also presenting an image from the “Camera” but the “Camera” was turned off and the image was static.
When I turned the “Camera” on all (now 7) instances returned similar results;
Task Manager memory usage CAN be misleading. It isn’t wholly accurate. If you minimise a Windows application often memory usage shrinks, a lot. This may not be your issue here, but you can’t solely rely on Task Manager
You want page file usage. Here is an old snippet of code I still use:
//------------------------------------------------------------------------------
// CsiGetProcessMemory
//
// Return the amount of memory used by the process
//------------------------------------------------------------------------------
function CsiGetProcessMemory: Int64;
var
  lMemoryCounters: TProcessMemoryCounters;
  lSize: Integer;
begin
  lSize := SizeOf(lMemoryCounters);
  FillChar(lMemoryCounters, lSize, 0);
  if GetProcessMemoryInfo(CsiGetProcessHandle, @lMemoryCounters, lSize) then
    Result := lMemoryCounters.PageFileUsage
  else
    Result := 0;
end;
I did search for your CSI Framework and found download references on old ADUG websites from your presentations but it seems www.csinnovations.com is no longer. Is the framework code still available for general use?
Not to worry I just saved the snippet (with accreditation) to look at later and if needs must I can possibly resolve the Process ID or bother you again. I might even have a copy of the framework buried in my past downloads.
Yes. I will sort something out (I have a full copy on me). There are a lot of useful routines there, even if you just use those
As an aside, I managed, after 3 months full-time work in 2008, to get a version to build with Dephi.NET using the .NET Framework. For the past 15 years I have been developing C# systems built on top of the original Delphi code. Systems run as .NET Framework 4.8 applications but can’t come across to .NET Core (and .NET 5+) – that’s OK. That’s 15 years of production use! So I have got a LOT of mileage out of the original code